


Demand forecasting in real estate has always been a puzzle for economists. Economics suggests consumption products like iPhone, cars, mobile data, have a falling demand curve which means as price falls their consumption increases.
For investment products like equities, as prices fall, trading volumes normally come down indicating lowered demand. However, when it comes to real estate, demand forecasting becomes a complex exercise, some buy homes for consumption, some for investment and there are others who look at homes for investment-cum-consumption. Therefore, demand forecasting has always remained a puzzle. However, a broad-based analysis can definitely throw a good amount of light on the expected trend.
= 768 && (adKey.indexOf(\”Moneycontrol\”) != -1) && (adKey.indexOf(\”Moneycontrol_Mobile_WAP\”) = 768 && (adKey.indexOf(\”MC_ENG_DESKTOP\”) != -1 ) && (adKey.indexOf(\”MC_ENG_PWA\”) < 0) ){ googletag.cmd.push(function() { googletag.display(\"MC_ENG_PWA/MC_ENG_PWA_NEWS/MC_ENG_PWA_NEWS_AS/MC_ENG_PWA_ROS_NWS_AS_ATF_300\") }); }if (width
A. 30-year empirical evidence
A 30-year period is generally considered to be a large period to analyse long term trends (see Table 1).
Close
= 768 && (adKey.indexOf(\”Moneycontrol\”) != -1) && (adKey.indexOf(\”Moneycontrol_Mobile_WAP\”) = 768 && (adKey.indexOf(\”MC_ENG_DESKTOP\”) != -1 ) && (adKey.indexOf(\”MC_ENG_PWA\”) < 0) ){ googletag.cmd.push(function() { googletag.display(\"MC_ENG_PWA/MC_ENG_PWA_NEWS/MC_ENG_PWA_NEWS_AS/MC_ENG_PWA_ROS_NWS_AS_FLY_300\") }); }if (width
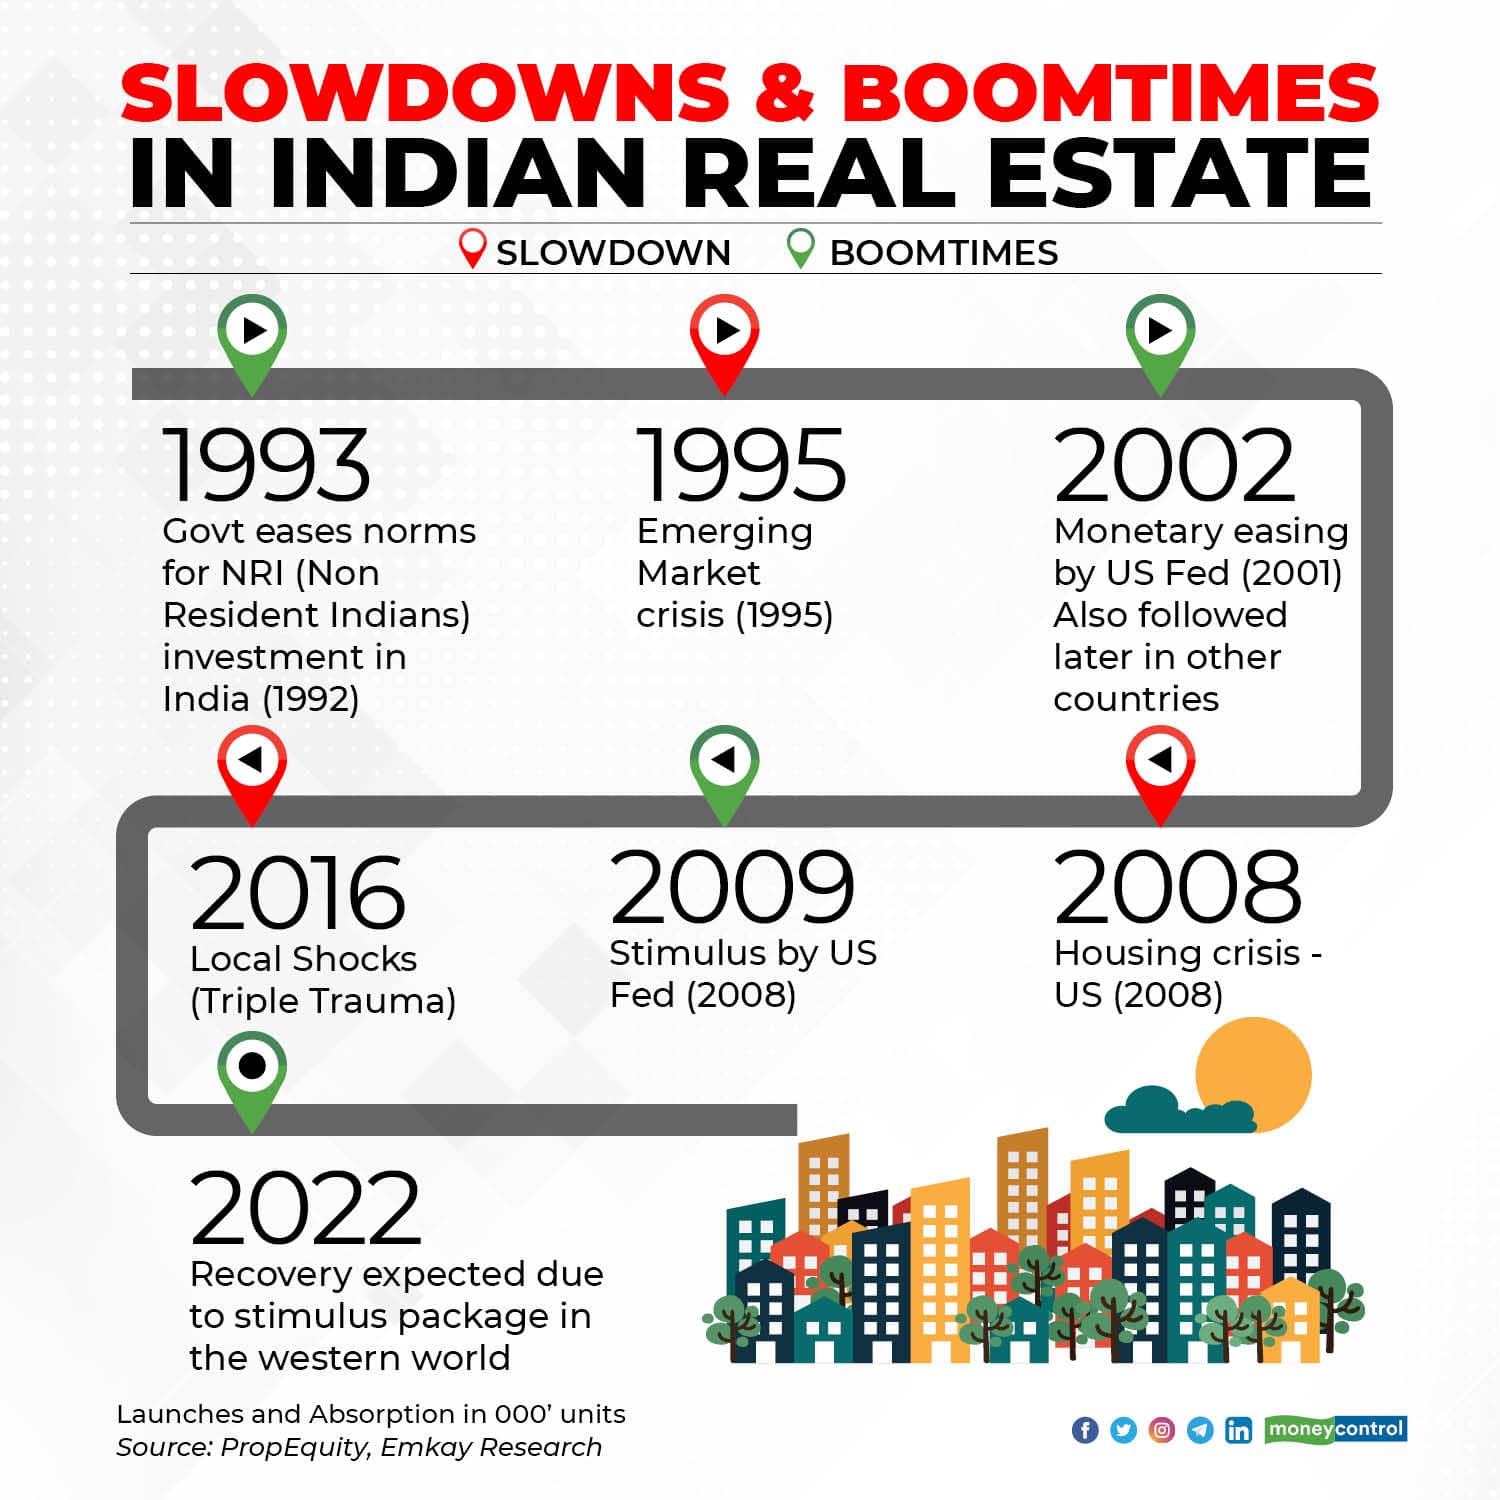
Since 1990, there have been three bull runs and three slowdowns in the property market. Interestingly, all of these have been driven by big-ticket events.
In 1992, the government eased norms for the flow of NRI money into Indian real estate. This big decision led to the first bull-run in 1993 that lasted till the emerging market crisis of 1995. During \’93-95, many NRIs had their first taste of buying a property in India. Navi Mumbai was the biggest beneficiary of this bull-run.
The slowdown of late 90s was reversed by the quantitative easement undertaken by the US Central bank in 2001 after the 9/11 crisis. Many other central banks followed easy money policies. The free-flowing money found its way into Indian real estate, largely through FDI in real estate. This triggered a historic real estate boom that lasted till the US housing crisis of 2008.
To fight the housing crisis, the US government propelled a massive liquidity push. With many countries following the big daddy, the global liquidity again found a way into Indian real estate through Real Estate funds, HFCs etc. So post-2009, we again saw a major upswing in realty prices coupled with huge volumes.
= 768 && (adKey.indexOf(\”Moneycontrol\”) != -1) && (adKey.indexOf(\”Moneycontrol_Mobile_WAP\”) = 768 && (adKey.indexOf(\”MC_ENG_DESKTOP\”) != -1 ) && (adKey.indexOf(\”MC_ENG_PWA\”) < 0) ){ googletag.cmd.push(function() { googletag.display(\"MC_ENG_PWA/MC_ENG_PWA_NEWS/MC_ENG_PWA_NEWS_AS/MC_ENG_PWA_ROS_NWS_AS_BTF_300\") }); }if (width
And then in 2016-17 came in the Triple Trauma for real estate developers (Demonetisation, GST and RERA). This led to a big slowdown in real estate markets across India.
After Covid-19 hit, we again have a scenario where most of the Western economies have developed oceans of liquidity. This has made yields on treasury bonds close to or below zero. Therefore, in all likelihood, one will see this surplus money making inroads into Indian real estate during the next twelve months. The only possible outcome will then be an upswing in real estate by 2022.
B. City-specific analysis
While the real estate market in every Indian city has its own character but most large cities have followed the Mumbai market. Since Mumbai remains the largest real estate market, it will continue to determine trends across India. Most local indicators in Mumbai now confirm the impending bottoming out of Mumbai market.
1. Reducing gaps between incomes and EMIs
The lockdown has resulted in lower income for homebuyers. However, over the years, incomes have been increasing and property prices and interest rates have been moving southwards. As a result, we have a situation where the EMI-to-income ratio has come down from about 50 percent in 2014 to about 25 percent in 2020. And this is a very healthy indicator.
2. Steady demand and reducing supply
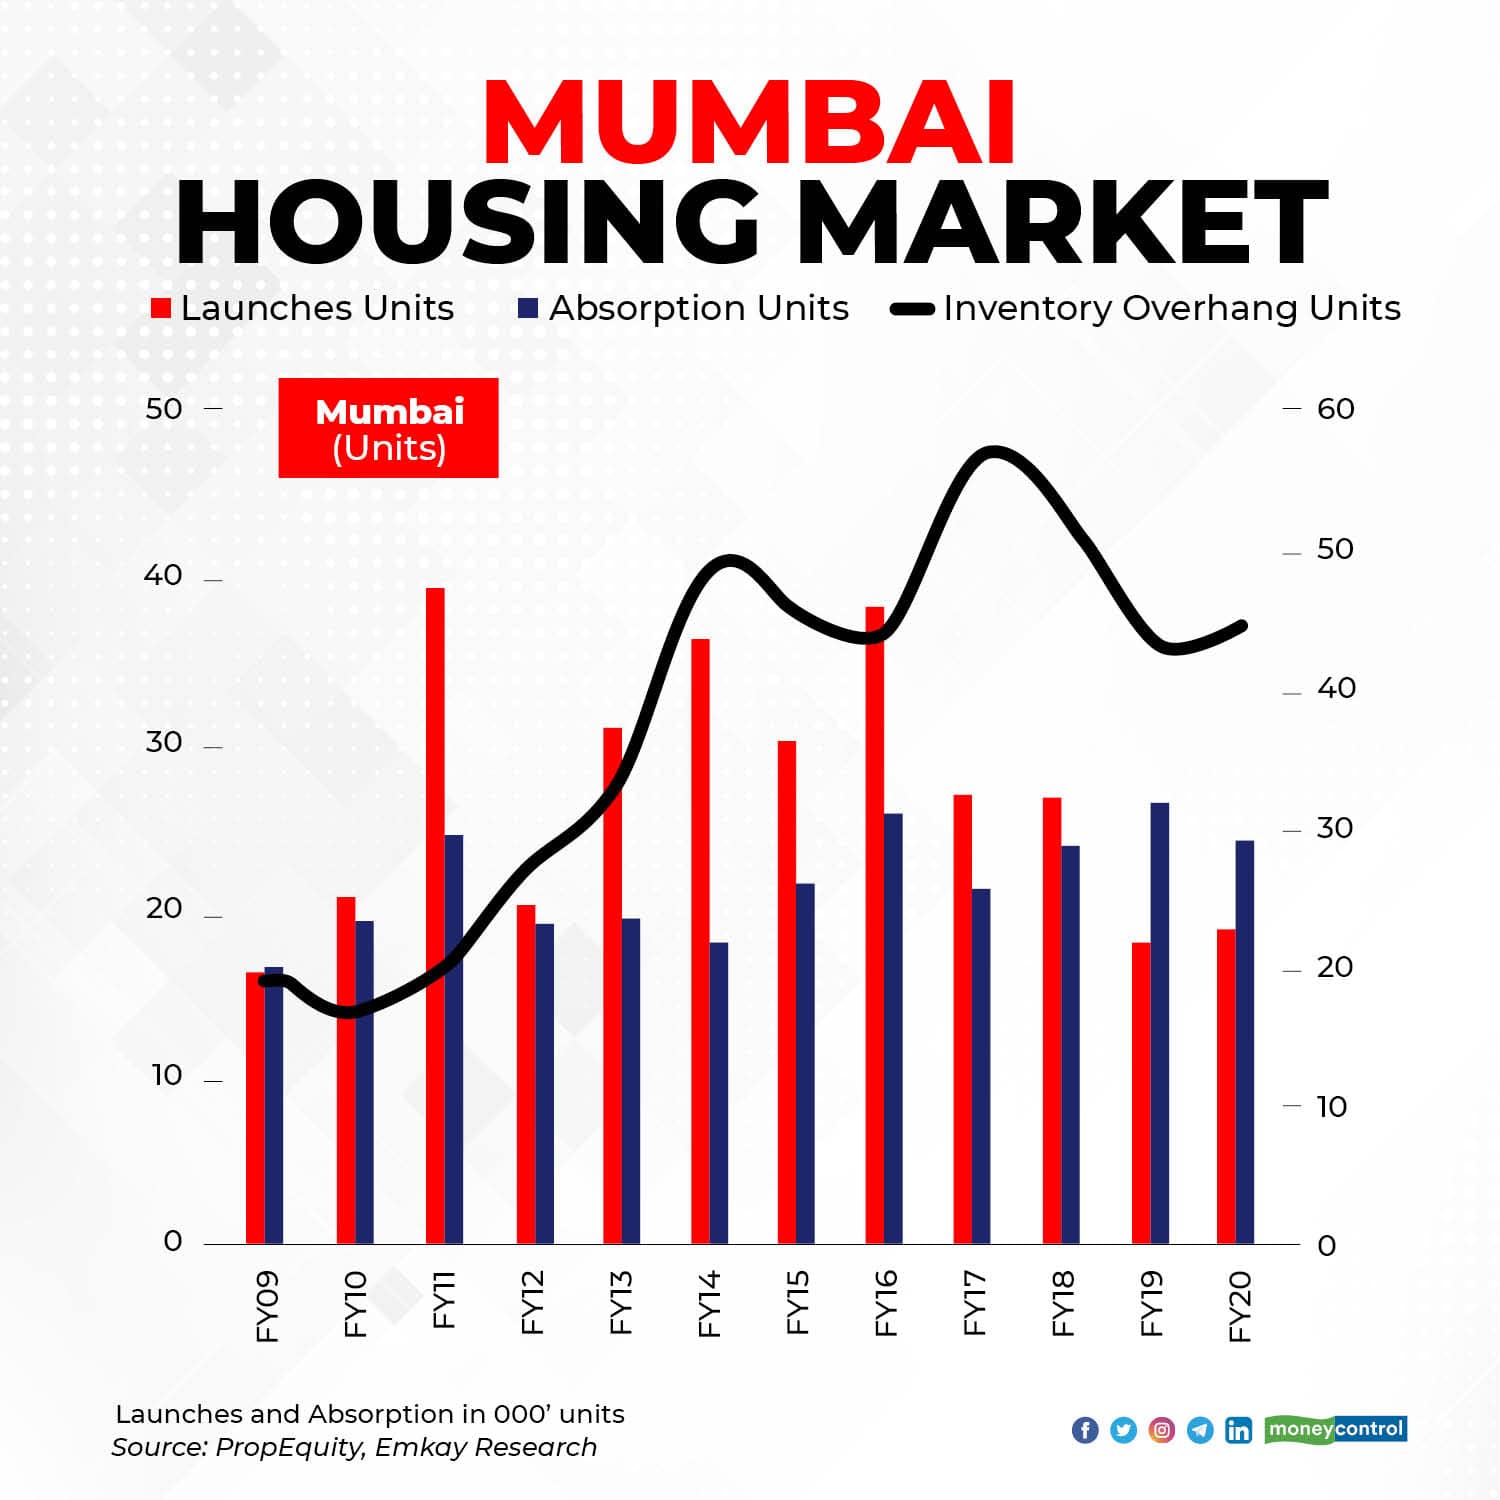
During the last three years, the high level of debt in a developer’s balance sheet had forced them to liquidate inventory to make their commitments to the lenders. As a result, we experienced falling market prices. With more money flowing into the system, this pressure will come down resulting in significantly lower stress levels and fewer discount deals. Furthermore, the number of developers in Mumbai has come down by 40 percent which would further work towards tightening the supply.
On the demand side, Mumbai’s annual sales have been steady at 25,000-30,000 residential units (see Table 2). Steady sales in a bearish market indicate the market has been almost completely dominated by end-users (most investors prefer investing in a rising market). What further confirms early signs of an upcoming bull market is that the annual supply of housing units in Mumbai market has been coming down. In fact, during the last two years, the supply has lagged behind the actual demand and this deficit has reduced the inventory overhang. Therefore, we are not very far from the point of inflexion.
3. Increasing cost for developers
The logic that reduction in demand for new homes or fall in their prices would lead to a crash in land prices will not work. This is because the supply of clear title open land is extremely limited. Majority of the fresh supply of housing in Mumbai comes from the redevelopment. In the case of redevelopment projects, the cost of land largely comprises the cost of rehabilitating the tenants.
Over the years, due to changes in regulation and due to higher demand by the tenant the cost of rehabilitation has significantly increased. Accordingly, there is hardly any rehabilitation projects that is feasible below a selling price of Rs 20,000 per sq ft of carpet area.
With construction cost being inflationary, this cost is only going to increase. Therefore, the potential for cheaper supply coming through redevelopment has faded away. Accordingly, reducing supply coupled with the increasing cost of operations would mean that Mumbai housing will now have to prepare itself for cost-push inflation.
4. Reducing gaps between Rental yield and bank FD rates
In the past, rental yields in Mumbai were a low of 1.5-2 percent. With the fall in property prices and increase in rental over the years, rental yields are now in the range of 3-4 percent. During the same period, the interest on bank FDs has reduced from 8-8.5 percent to about 5-6 percent. This has significantly reduced the incentive to defer the decision to purchase a property.
With most of the deflationary factors having fizzled out, the consumption-driven buyers are using the current opportunity to buy the largest possible apartment their incomes can justify. At the same time, the investment-driven customers are waiting for the inventory to deplete further. However, given the easy global money and reduced supply, the wait for the bottom is unlikely to go beyond 2021.
Source
